
A sustainability figure becomes useful to an operating manager when its meaning, origin and limitations are clear. A central dashboard can make information easier to find, but it cannot supply those qualities by itself. Kawan Food’s October 2024 account illustrates the distinction between announcing environmental progress and building the data process needed to understand that progress. The management question is how records become evidence for decisions about equipment, energy use and priorities.
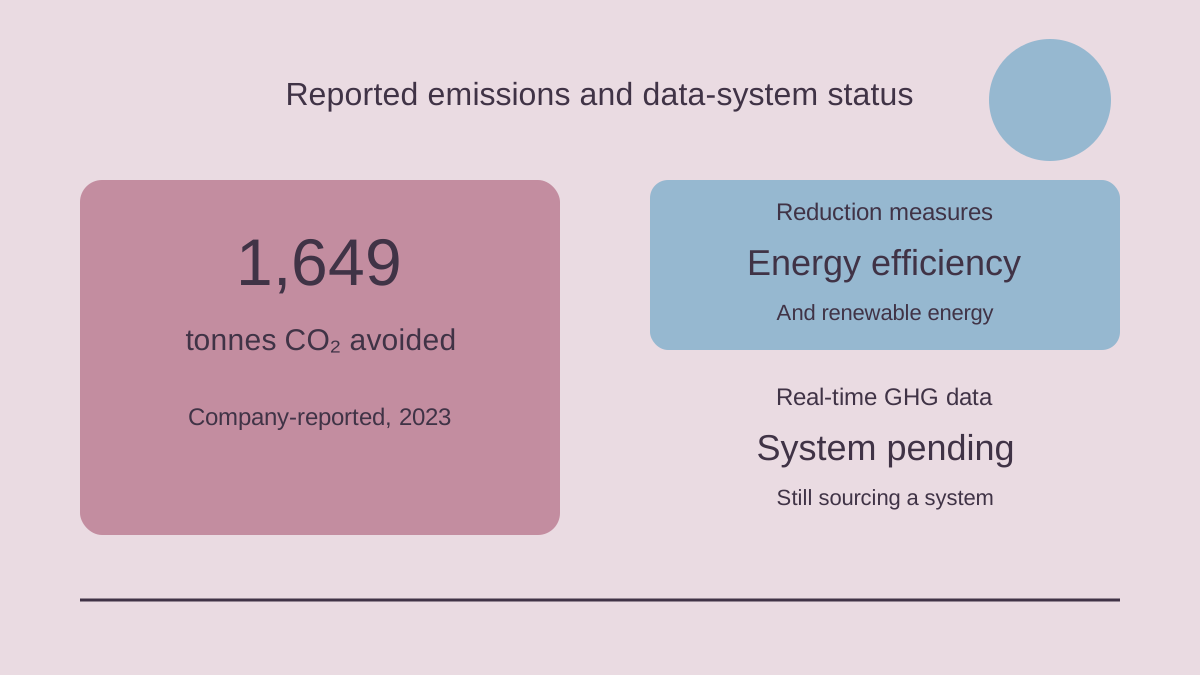
In a The Edge Malaysia article published on 28 October 2024, marketing director Gan Ka Bien described difficulties capturing and analysing sustainability data. Kawan Food was sourcing a system to centralise that information in real time. The report cited 1,649 tonnes of CO₂ avoided through energy efficiency and renewable energy in the company’s 2023 annual report, and its intention to strengthen measurable targets in 2024. It also covered recognition at the publisher’s own ESG awards. These attributed statements do not establish an independently verified inventory or a completed system deployment.
Define the question before choosing the dashboard
A system procurement exercise should start with the decisions it is expected to support. Comparing energy use between production periods is one task. Evaluating a proposed improvement is another. Preparing a public disclosure is a third. They may share records, but their calculations, review requirements and update schedules can differ. Combining them without defining the purpose can produce an impressive screen that does not resolve the manager’s actual question.
For example, an operating team may want to identify an unusual change at a particular meter. A reporting team may need a consistent company-wide total for a completed period. The first task values prompt notification; the second also requires completeness and reconciliation. These are proposed use cases, not claims about the systems already in place at Kawan Food.
A useful specification would therefore describe the user, the decision, the required records and the evidence needed to trust the output. It would also explain what the system is not yet able to measure. That boundary is practical: an incomplete estimate can still help investigate an issue if its status is visible. It becomes misleading when it appears beside verified values without any distinction.
Keep the reporting boundary visible
A number without a defined coverage cannot reliably be compared with another number. An internal data review would need to establish which facilities, activities and time periods are included. It should identify whether a record concerns one process, one site or the group. The source does not disclose a complete measurement boundary, so this article does not assign one to the company.
The boundary also has a time dimension. A record for a completed year is different from an estimate for an unfinished month. A new facility or a change in the way records are consolidated can alter a comparison even when the underlying operating efficiency has not changed. Before interpreting a movement, the reviewer should establish whether the two periods cover comparable activities.
For management purposes, the useful control is a record of coverage changes alongside the values. If a comparison has been adjusted, the adjustment should be explained. If it has not, the limitation should remain visible. A clear boundary does not guarantee an accurate result, but it prevents readers from assuming a broader or more consistent comparison than the records can support.
Avoided emissions and an emissions inventory answer different questions
The GHG Protocol’s December 2023 comparison of accounting approaches distinguishes an inventory within defined boundaries from a project’s effects relative to what would have happened without it. It also explains that estimated avoided emissions from project accounting are reported separately from inventory totals. That methodological distinction predates the company account considered here.
The practical implication is that an avoided-emissions figure should not silently become a claim about a matching fall in the company’s total emissions. To understand the first figure, a reader needs the comparison scenario and assumptions. To understand the second, the reader needs comparable inventory records over time. One may help evaluate an intervention while the other helps follow the organisation’s reported footprint.
The source article does not provide enough detail to reconstruct the company’s calculation. This analysis therefore preserves the original description rather than supplying a missing baseline or making a new environmental claim. A careful follow-up would request the method, covered activities and comparison period. It would also ask how the project result is presented alongside other indicators without counting the same effect twice.
An intensity measure needs an explicit denominator
An intensity ratio divides an emissions amount by a measure of activity. Its interpretation depends on both parts of the calculation. If the denominator is output, a reviewer needs to know what output means and whether product categories are comparable. If the denominator is revenue, changes in selling value can affect the ratio even when the physical process has not changed.
As an arithmetic possibility, intensity can improve while total emissions increase if activity grows faster than emissions. The reverse relationship is also possible. This is why a ratio and an absolute amount should remain separate in a management discussion. Neither outcome is asserted for Kawan Food: the necessary series and denominator are not supplied in the short report.
A practical data dictionary would state the numerator, denominator, units, coverage and calculation period for each ratio. It should also identify whether a change in the product mix could influence the comparison. That information gives a manager a way to ask whether an apparent improvement reflects operating efficiency, a different activity base or several effects occurring together.
Preserve the path from a source record to a reported value
Centralising data is most valuable when users can trace a result back to the records that produced it. For an energy-related measure, a review might need meter readings, purchased-energy records, conversion assumptions and the version of the calculation used. These are examples of an evidence path, not a list of documents the company has publicly disclosed.
The original observation and the calculated result should not be treated as the same record. A reading can be corrected; an estimate can be replaced; a calculation factor can change. If the system overwrites the previous value without recording the reason, a later reviewer may be unable to explain why a reported total moved. An accessible history makes that explanation possible.
A useful control would preserve the original input, the transformation, the person responsible for review and the date of approval. It should connect revised results with the reason for revision. The purpose is not to make every user inspect every record. It is to ensure that someone can investigate a material difference rather than trusting a final number simply because it appears in a common interface.
Real-time collection and verified reporting run on different clocks
The value of frequent collection depends on the decision. A prompt signal can help an operator investigate an unexpected pattern. A verified reporting total may need further checks before it is suitable for a wider audience. More frequent updates do not automatically mean better accuracy, particularly when source information arrives on different schedules or requires manual review.
A practical interface could distinguish provisional readings, estimated gaps and approved period totals. It could also show the last update and the proportion of expected records received. Those labels help users understand whether a movement reflects operations or simply the arrival of missing information. They are proposed design choices, not evidence that the planned system already includes them.
The procurement process should test the full sequence: collection, validation, correction, approval and reporting. A demonstration using only clean example data would not show how the system handles incomplete records or revisions. Testing difficult cases matters because an operating decision may be made precisely when the data are unusual. The question is whether the process remains understandable under those conditions.
Assign responsibility for exceptions as well as routine collection
Data quality needs ownership. Someone must know when a reading is expected, how an error is investigated and who can approve a correction. A system can flag a missing item without resolving why it is missing. Without a defined response, the same exception may persist across reporting cycles while the dashboard continues to look complete at a higher level.
A sensible allocation would separate the person supplying an observation from the person reviewing a material adjustment where the organisation can support that arrangement. It would also establish an escalation route for unresolved differences. This is a suggested control design; it is not an assertion that the company’s current responsibilities are inadequate or that a specific staffing arrangement is mandatory.
Responsibility also applies to communication. The person preparing a public statement should know which values are approved and which limitations must accompany them. An operating team should know whether a comparison is suitable for a decision at its level. Clear ownership links those uses without assuming that every audience needs the same detail or that one approval resolves every possible interpretation.
Test a system with decisions and records, not only features
A supplier may demonstrate charts, automated imports and alerts. A buyer still needs to establish whether those functions work with the records it can actually provide. The first test should use a defined, limited operating case with a known expected result. That makes it possible to identify whether a mismatch comes from the input, the calculation or the way the result is displayed.
A pilot should include a missing record, a corrected reading and a changed calculation assumption. Reviewers should check whether the system preserves the distinction between an observation and an estimate and whether it can reproduce an earlier approved report. These are practical acceptance tests for a data process, not a description of a pilot Kawan Food has completed.
The scope can then expand when the evidence supports expansion. Buying a broad set of functions at once does not establish that every function is ready for use. The management objective is a reliable path from records to decisions. A modest process that users can explain may provide more useful evidence than a more elaborate interface whose calculations and exception handling remain obscure.
Connect measurement with an operating action
Data become valuable when they help decide what to investigate or change. A trend can point to a process worth examining, but it cannot automatically establish the cause of that trend. The operating review should connect the observation to a plausible explanation and then seek evidence for that explanation. The case report supplies no process-level data from which to choose a specific intervention.
A proposed improvement would need a clear starting condition, the change being tested and a method for evaluating the result. Other changes in activity should remain visible during the comparison. If several interventions happen together, attributing the whole movement to one of them may overstate its contribution. A transparent review would retain that uncertainty rather than force a single success narrative.
The same discipline applies to resource allocation. A measurement programme uses staff time and system resources. Its benefit depends on whether the resulting evidence supports better decisions, more reliable reporting or both. The announcement does not disclose the cost of the proposed system, so this analysis does not estimate a return on investment or claim that a particular purchase would pay for itself.
A management checklist for usable sustainability data
For a manufacturer in Malaysia, the case offers a practical set of questions about turning environmental reporting into an operating process. This checklist is an analytical proposal based on the distinction between statements and supporting records. It is not a claim that the company has published the same method or a complete list of regulatory obligations.
- State the decision each indicator is meant to support.
- Define the activities, facilities, units and periods included.
- Separate inventory changes, intensity ratios and project comparison results.
- Preserve original records, calculation versions and explanations of revisions.
- Label estimates, missing information and approved totals distinctly.
- Assign an owner and an escalation route for material exceptions.
- Test procurement against difficult records and reproducible results.
- Connect an observed change with an investigation before claiming a cause.
These questions also help an external reader judge the strength of a public claim. An award can identify recognition, but it does not replace the method and records behind a particular indicator. A statement about a future system identifies an intention, but it does not prove that the process is already operating. The October account is useful precisely when those distinctions remain visible.
The next evidence would be information about defined indicators, the system’s implementation status and comparable results produced through a documented process. Those later developments are not supplied by the historical article. Keeping them separate preserves the case as an account of a management challenge at the time: moving from scattered information and reported progress toward data that can be checked, interpreted and used.