
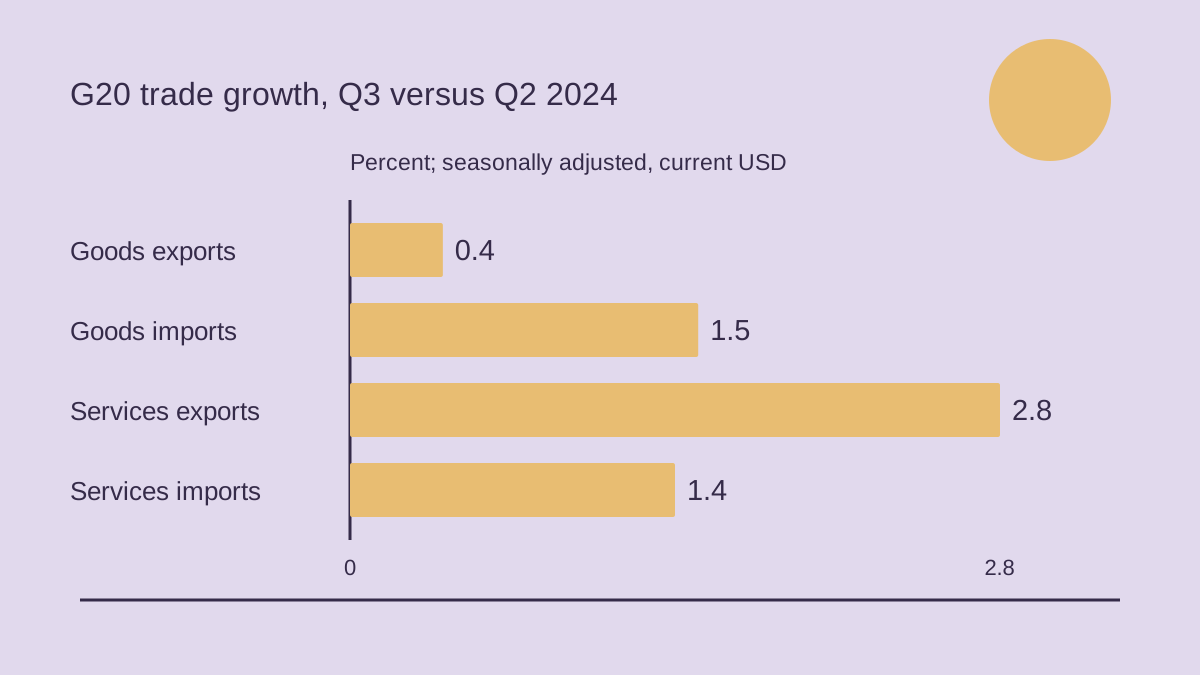
G20 merchandise exports increased 0.4% in the third quarter of 2024 compared with the second quarter, while imports rose 1.5%, Anadolu Agency reported on 26 November, citing OECD statistics. Services exports grew 2.8% and imports 1.4%. The figures measure seasonally adjusted trade values in current US dollars.
Different directions in major economies
The difference between Japan’s increase and China’s decline was 8.3 points.
Products behind the changes
The OECD’s release links US merchandise growth to capital goods, including semiconductors. European exports benefited from German pharmaceuticals and Italian apparel and food products. Japanese exports were supported by electrical and metalworking machinery and scientific instruments; weaker Chinese exports reflected furniture and plastics.
- Indonesia: goods exports up 3.5%, imports up 11.8%, with machinery driving purchases.
- Australia: goods exports up 0.7%, imports down 0.5%.
- China: services exports up 16.4%, imports down 4.2%, contrasting with its goods contraction.
What is included in the combined figures
The OECD’s February 2024 technical note explains that the aggregate combines 16 economies outside the EU with the EU27. It includes trade between G20 economies and intra-EU flows. France, Germany and Italy are represented through the EU aggregate, rather than added again as separate national totals.
The latest services estimate uses partial information covering at least 60% of the aggregate and is subject to revision. African Union members other than South Africa are excluded because of data constraints. Goods exports generally use free-on-board valuation; imports generally include insurance and freight. These specific compilation choices underpin the November release’s group totals.