
Henderson’s annual results provide a useful starting point for a question that reaches beyond one clothing retailer: what does an operating margin actually include? The 28 April 2025 Interfax report describes higher revenue and profits for the business in Russia. The company’s accompanying release also presents two EBITDA margins, calculated using different lease accounting bases. Their coexistence makes the definition of the measure central to any comparison. This analysis considers the evidence available at that publication date and proposes a way of evaluating the figures without treating an accounting presentation as a change in the underlying obligation to pay for premises.
The comparison begins with a definition
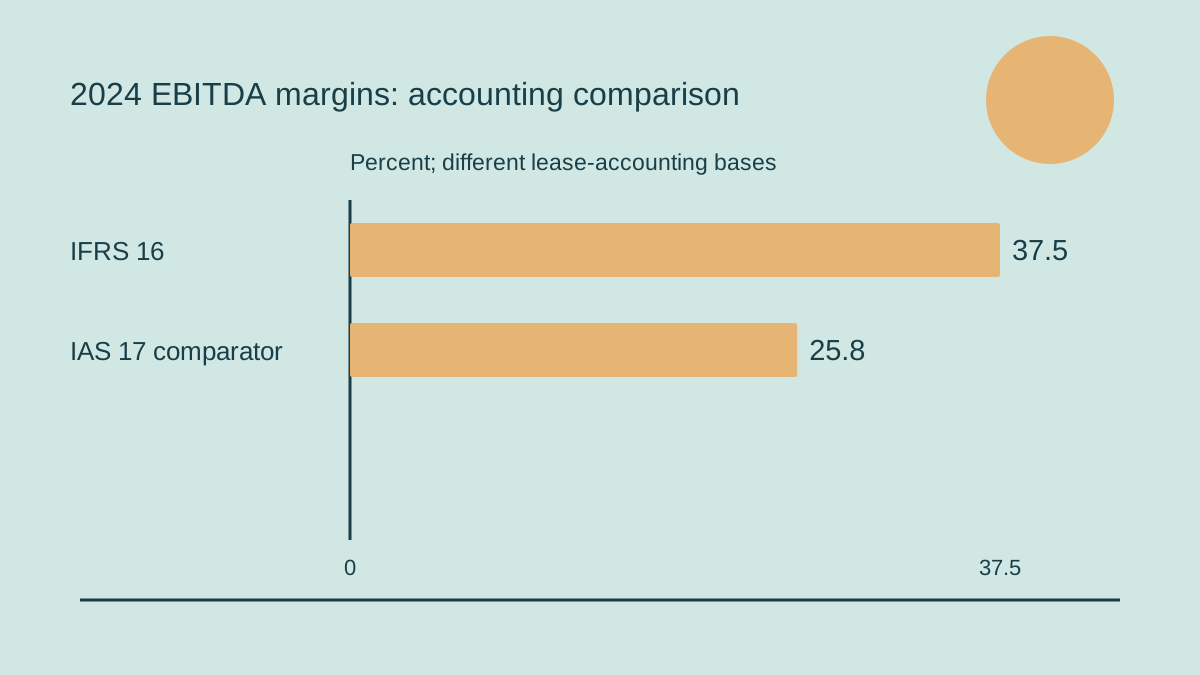
In its dated financial release, Henderson reports 2024 revenue of approximately RUB 20.840 billion, gross profit of RUB 14.218 billion, EBITDA under IFRS 16 of RUB 7.809 billion and net profit of RUB 3.050 billion. The disclosed EBITDA margins are 37.5% under IFRS 16 and 25.8% on an IAS 17 basis. Subtracting those rounded percentages gives an 11.7 percentage point difference. This calculation identifies the scale of the presentation difference; it does not establish the amount of rent paid, a saving on rent, or the value of a lease liability. Those are separate questions requiring a reconciliation and additional disclosures.
The most useful first step is therefore to label the numerator before interpreting its size. EBITDA is earnings before interest, tax, depreciation and amortisation, rather than a comprehensive statement of money available for distribution. A margin expresses a specified earnings measure relative to revenue. If the specified earnings measure changes, the resulting percentage can change even while the business continues to occupy the same premises. Reading only the larger percentage would remove an important qualification from the company’s own presentation. Reading only the smaller percentage would also lose information about the reported basis. A careful comparison keeps both figures visible and explains which question each is intended to answer.
Lease recognition does not cancel a contract
The IFRS Foundation’s explanation of IFRS 16 establishes the relevant framework. The standard replaced IAS 17 and took effect for annual reporting periods beginning on or after 1 January 2019. Its lessee model generally requires recognition of a right-of-use asset and a lease liability for leases longer than twelve months, with an exception for low-value assets. Recognition makes the right to use an asset and the related obligation visible in the accounts. It does not by itself renegotiate the commercial arrangement. For this article, that established framework is sufficient; later standard-setting projects and later company results are outside the historical comparison.
Consider the contractual question independently of the reported margin. A retailer needs to know when payment falls due, how the amount can change and what conditions permit departure from the premises. Those questions continue to matter whichever earnings presentation is used. An accounting measure can help describe performance, but a landlord receives payments according to the agreement. It follows that an improvement in the appearance of one earnings measure is not evidence that the agreement has become cheaper. Equally, recognising a liability is not proof of an operational failure. The analytical task is to connect the presentation with the contractual economics, while avoiding conclusions that the disclosed figures alone cannot support.
Growth rates and margin levels answer different questions
The release reports revenue growth of 24.3%, EBITDA growth of 18.9% and net profit growth of 29.7%. These are year-on-year rates of change in different totals. They should not be read as three interchangeable measures of profitability, nor should they be compared directly with the two EBITDA margin levels. A growth rate uses the preceding year’s amount as its denominator; a margin uses current revenue. Keeping those denominators explicit prevents a percentage from acquiring a meaning it never had. It also leaves room for a more useful question: whether a particular comparison uses the same earnings definition, reporting period and business perimeter on both sides.
The different growth rates do not, by themselves, explain why net profit changed. Establishing that explanation would require the relevant expense and financial statement bridges. This analysis does not attribute the movement to borrowing costs, tax, exchange rates or a particular store programme without that evidence. The disciplined reading is narrower: the reported measures grew at different rates, and the release supplies different lease bases for EBITDA. An analyst can identify the next evidence needed without inventing the answer. That distinction matters because a plausible story about costs can become more persuasive than the actual disclosure, especially when several positive headline figures appear together.
Make historical and peer comparisons consistent
For a historical comparison, the same definition should be applied to both years. A table that places an IFRS 16 figure for one period beside an IAS 17 comparator for another would mix measurement systems. The result could suggest a change in trading performance that partly reflects a different accounting basis. The remedy is practical: attach the basis, period and perimeter to every observation before calculating a trend. Where a restated comparator is available, identify it. Where one is unavailable, mark the comparison as incomplete. An empty cell with an explanation is more informative than a precise growth calculation built from incompatible numbers.
For a peer comparison, lease treatment is only the first consistency test. Two retailers may also differ in the treatment of exceptional items, the scope of consolidation and the amount of property they own. A table headed simply “EBITDA margin” can hide these differences. A proposed comparison sheet should record the definition used by each company, the exact adjustments included and whether the underlying statement supplies a reconciliation. Only after those fields are filled should the percentages be ranked. This process does not guarantee identical business models. It makes the remaining differences visible, so the ranking is read as a qualified comparison rather than a verdict on operating quality.
A cash bridge needs its own evidence
A question about cash available after occupying premises needs information beyond an EBITDA margin. At a minimum, the reader would seek the cash flow statement, lease payment disclosures and a reconciliation between the reported earnings measure and the starting point for the cash analysis. The period of each item must match. Payments relating to a different period cannot simply be subtracted from an annual margin and described as a reconciled result. Nor can the 11.7 percentage point difference be multiplied by revenue and labelled actual cash rent without evidence that the definitions and adjustments support that interpretation. The tempting shortcut substitutes arithmetic for the missing accounting explanation.
A proposed bridge should separate observed disclosures from unresolved questions. One column can contain figures explicitly reported by the company; another can contain the reconciliation steps; a third can state which information is missing. This structure prevents an estimate from silently becoming a reported fact. It also helps distinguish a recurring operating question from the timing of payments. A business can have strong earnings and still face a concentrated payment schedule, but that possibility is not a claim about Henderson’s schedule. Establishing such a concentration would require its dated obligations and available resources. The purpose of the bridge is to organise that evidence, not to presume a cash problem.
Compare occupying options on matched terms
A decision between leasing and owning premises illustrates why a single earnings measure cannot settle every operating question. In a hypothetical comparison, ownership requires a different commitment of capital and exposes the business to different property risks. Leasing creates contractual commitments and may provide different options for changing location. The appropriate comparison should hold the commercial task constant: the same usable space, service requirement, decision horizon and assumptions about demand. It should then include the relevant payments, capital commitment and exit conditions for each option. This is a proposed decision framework, not a description of Henderson’s property strategy or a claim that one form of occupation is always superior.
Flexibility must also be defined rather than assumed. A shorter agreement may create an earlier opportunity to leave, but a renewal right, a break condition or a required notice period can alter its practical value. Ownership may offer control over the premises while making disposal slower or more costly. These features belong in the comparison even when they do not appear in the headline earnings margin. A useful decision paper would specify who bears maintenance obligations, what expenditure is needed to use the location and what happens if the location is no longer commercially suitable. Without those matched terms, a financial percentage can give a false sense that unlike alternatives have been evaluated fairly.
Build a store decision sheet around responsibilities
Group results provide context, while a decision about a particular location needs evidence at the appropriate level. The following proposed checklist identifies information a retailer could assemble before renewing or committing to premises. It does not imply that Henderson lacks these controls, and it does not describe figures available for its individual stores. The objective is to keep the reporting measure connected to a decision that a manager can actually implement. Each field should name the responsible team, the source document and the date of verification. That ownership makes it possible to resolve disagreements about assumptions before the final decision, rather than discovering them after a commitment has been made.
- Define the earnings measure and reconcile any lease-related adjustments to the chosen reporting basis.
- Record contractual payments, review mechanisms, relevant dates and the conditions for renewal or exit.
- Specify fit-out commitments, maintenance responsibilities and expenditure needed to preserve the agreed service.
- Separate location-specific costs from shared costs, and identify which costs would actually change under each option.
- State the decision horizon, demand assumptions, evidence gaps and the person authorised to approve the commitment.
The distinction between allocated and avoidable costs deserves particular attention. A store can carry a share of central overhead in a management report even when closing it would leave most of that overhead in place. Conversely, an apparently small location-specific commitment can require additional support elsewhere in the organisation. A decision sheet should therefore show both the allocation used to report performance and the expected change in resources under the proposed action. Mixing them can overstate the benefit of an exit or understate the cost of a renewal. This is a general managerial distinction; the group release does not provide the data needed to calculate either effect for a particular Henderson location.
Stress the commitment, not just the headline
A hypothetical stress test should change one assumption at a time before combining adverse conditions. For example, a retailer could examine a weaker contribution from the location while leaving the contractual payment schedule unchanged. A separate test could examine a contractual payment increase while holding the contribution assumption constant. The purpose is to identify the mechanism that changes the decision, rather than produce a dramatic scenario with no explanation. The stress values must be explicitly chosen assumptions, with reasons and an owner. They are neither a forecast of Henderson’s sales nor evidence that its leases contain a particular review clause. No company-specific stress result can be inferred from the two published margins.
The next question is what action remains possible at the point of pressure. A theoretical saving from relocation has limited decision value if notice requirements or fit-out commitments prevent an immediate move. A proposed stress paper should pair each scenario with the earliest feasible action, the contractual condition that permits it and the cost of implementation. It should also distinguish a temporary reduction in contribution from a persistent deterioration that changes the case for occupying the premises. This makes the analysis useful to operations and finance together. A percentage alone does not communicate either the time available to respond or the constraints on that response.
Keep the conclusion within the disclosed evidence
Henderson’s release gives readers a reason to compare performance carefully rather than select whichever EBITDA margin appears more attractive. The disclosed lease bases produce materially different percentages, and the difference itself is analytically relevant. It signals that any historical trend, peer ranking or operating decision needs an explicit measurement basis. It does not identify the retailer’s cash rent, demonstrate an accounting error or establish that one set of commercial commitments is affordable under every circumstance. Those stronger conclusions need their own evidence. Keeping that boundary visible allows the annual results to inform a decision without making the results answer questions beyond the scope of the release.
The practical output of this reading is a sequence of work: label the earnings definition, align the comparators, obtain the lease and cash reconciliation, then evaluate matched operating alternatives. Where evidence remains unavailable, retain the question as an open item rather than replace it with an assumption presented as fact. The reported growth remains part of the business story, while the two margins help explain how that story is measured. A sound decision about premises connects the measurement to contracts, resources and feasible actions. That connection is what turns a financial headline into a useful operating analysis, with both its explanatory value and its limitations made clear.