
Revenue growth can describe a stronger business, a different product mix or a higher amount collected for the same physical quantity. Those explanations have different implications for a manufacturer planning additional capacity. Abi’s annual figures provide a useful case for separating the money measure from the tonnage measure before deciding what an expansion means. The exercise is about reading evidence: an improving sales headline does not automatically establish stronger physical demand or better profitability.
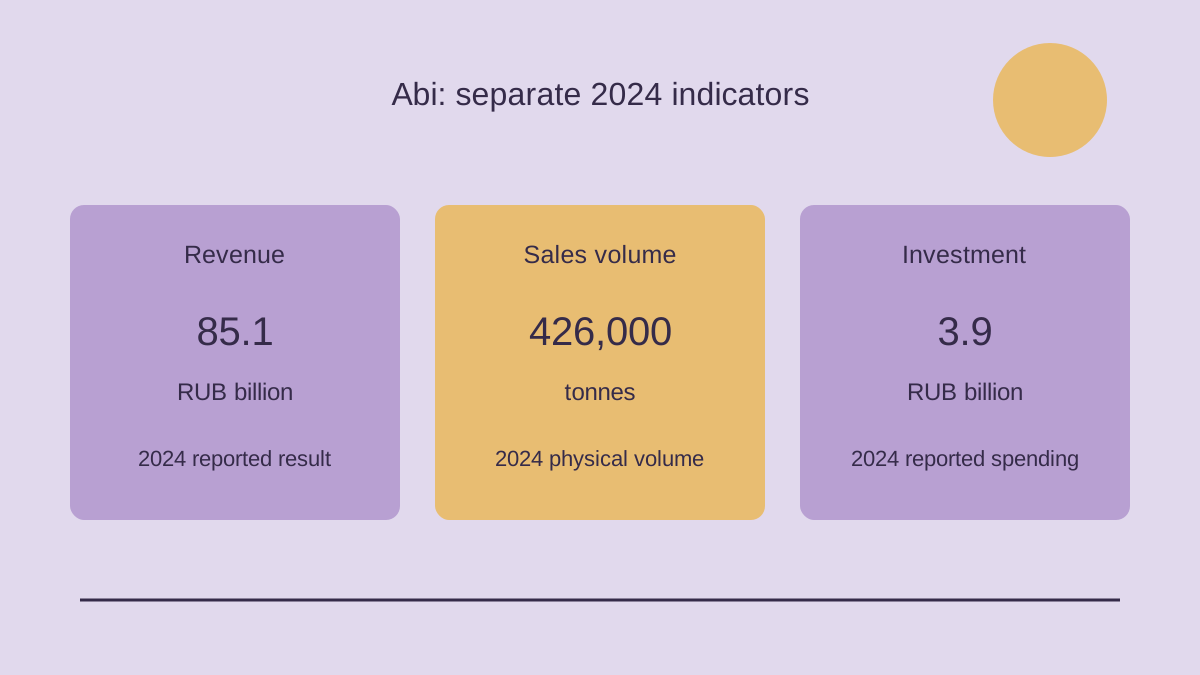
In an Interfax report dated 22 April 2025, citing Abi’s press service, 2024 revenue was RUB85.1 billion versus RUB78.3 billion a year earlier; sales were 426,000 tonnes versus 428,000. Reported investment was RUB3.9 billion. New capacity at Starodvorskie Kolbasy was described as the first of two projects in a RUB26 billion programme intended to double production, with the new plant’s stated productivity at 500 tonnes of finished products per day. Export revenue increased 7.3%. These are attributed company figures, not independently audited operating conclusions.
Two measures answer two different questions
The annual comparison has an immediate implication: the increase in money sales did not come with an increase in aggregate tonnes sold. That observation does not establish the cause. It establishes the question that a useful commercial review must answer. Did customers pay more for comparable products, did the manufacturer sell a different assortment, did the customer or channel mix change, or did several effects occur together?
Revenue is expressed in currency; physical sales measure an amount of product. Their growth rates need not match, particularly when a business has more than one product category. A tonne of one product may have a different selling value from a tonne of another. A shift between categories can therefore change the aggregate relationship even if the prices of every individual product remain unchanged. This is a possible explanation of the arithmetic, not a claim about what happened inside Abi.
The distinction should also guide language. Saying that sales increased without identifying the measure can leave a reader with the impression that more goods were sold. Saying that revenue rose while tonnage declined preserves the two observations. Neither formulation reveals whether buyers became more loyal, whether distribution improved or whether a particular brand gained share. Those are separate propositions requiring their own evidence.
Revenue per tonne is a diagnostic ratio
Dividing each year’s revenue by its corresponding sales tonnage gives approximately RUB199,800 per tonne for the later year and RUB182,900 for the earlier one. Calculated from the rounded reported values, the ratio increased by about 9.2%. This is our arithmetic, rather than an additional figure released by the company. The rounding of the input data also means the result should be treated as approximate.
Its name matters. Aggregate revenue per tonne is not the shelf price of a particular product, a company-wide price list or proof of a uniform price increase. The calculation combines the money numerator and physical denominator supplied in the report. A complete accounting comparison would first confirm that both cover the same business perimeter and sales period. The short announcement gives no detailed reconciliation of revenue categories to product quantities.
The ratio is nevertheless useful as a signal that something other than aggregate quantity contributed to the revenue movement. A manager can use that signal to choose the next investigation. The appropriate response is to request a breakdown, not to substitute an appealing explanation for the missing breakdown. A single average cannot reveal how much came from pricing, how much came from assortment and how much came from changes in where or to whom products were sold.
A price and mix review starts with comparable products
One practical approach would be to compare products sold in both periods on a consistent basis. The comparison should distinguish product identity, package weight, commercial terms and the customer channel. Without those controls, an apparent price movement might reflect selling a different item or a different pack rather than charging more for the same transaction. This is a proposed management method, not a description of Abi’s internal reporting.
New and discontinued products would need their own treatment. Removing them from a comparable-product comparison can help isolate changes within continuing lines, but it also excludes an important part of the overall business. A useful review therefore needs both views: the continuing assortment and the contribution of changes in assortment. Neither should be selected merely because it produces the most favourable growth number.
Commercial terms add another layer. A headline invoice value and the amount retained after agreed discounts, promotional support or other adjustments are different concepts. The source does not supply those terms. The analytical question is whether the revenue comparison consistently captures them. This prevents a discussion about average selling value from quietly turning into an unsupported claim about bargaining power.
The resulting bridge should connect the opening revenue figure to the closing figure through explained movements. It should identify the contribution of quantity, comparable-product selling value and assortment changes without counting the same effect twice. Where information is unavailable, the review should keep a residual category visible. An unexplained residual is more honest and more useful than allocating the entire difference to an assumed price increase.
Higher selling value does not establish a better margin
A manufacturer can collect more per tonne while spending more to make, package and deliver that tonne. The cost side matters just as much as the revenue side when interpreting commercial performance. The report does not disclose product-level production costs, operating profit or net profit. Consequently, the observed revenue movement cannot support a claim that profitability improved or that the business successfully passed every cost increase to buyers.
A meaningful margin review would compare the value retained from sales with the costs attributable to the relevant products and channels. It would need a consistent treatment of production overheads and other shared expenses. An apparent improvement in one category could otherwise reflect a change in cost allocation rather than a better commercial result. Again, these are questions for an investigation; the announcement does not answer them.
The same boundary applies to productivity. Higher revenue per tonne is a commercial ratio. It says nothing directly about tonnes per production hour, labour time per batch, material yield or downtime. Those operating measures could improve, worsen or remain stable while the average selling value changes. Keeping the measures separate helps avoid using a sales result as a substitute for factory evidence.
New capacity needs a sales route as well as a production rate
The investment announcement introduces a different scale of measurement: daily finished-product capacity at a plant, compared with annual physical sales across the company. These are not interchangeable numbers. A plant’s stated production rate is not proof of annual output, and company sales are not a direct utilisation measure for that plant. Combining the two without defining the perimeter would create a precise-looking but unreliable calculation.
To turn daily capacity into an annual operating expectation, a planner would need a working calendar, maintenance allowances, product schedules and a ramp-up assumption. To turn expected output into sales, the planner would also need a commercial route. Customers must order the relevant assortment, the distribution system must handle it and the timing of delivery must fit the product. The report provides no complete set of such assumptions.
Capacity can also have several purposes. A new asset might support growth, permit an assortment change or alter how production is distributed between sites. Those possibilities mean that a relatively flat company tonnage figure does not, by itself, prove that a newly opened facility was unnecessary. Equally, the existence of the facility does not prove that demand will absorb its maximum output. The evidence needed depends on the purpose of the investment.
The programme’s stated production ambition should remain an ambition. It does not mean that annual sales had already doubled by the reporting date. Nor does the year’s investment amount reveal the full programme’s completion status or the cost of each project. A clear account distinguishes annual expenditure, the scope of the announced programme, an opening milestone and the later operating contribution.
Product tonnes and equipment time need a separate comparison
A production schedule also needs a more specific unit than company-wide tonnes. Different products can require different processing stages, packaging operations or cleaning between batches. An aggregate quantity does not show which particular resources those products occupy. The source gives no process-level comparison, so a reader cannot translate the change in sales tonnage into a matching change in factory workload.
For a capacity review, the practical next step would be to connect each planned product group to the equipment time it requires. A change in assortment could shift workload between parts of a plant even without a large change in total tonnes. That is a general planning possibility, not a finding about Abi. Testing it requires product routes, achievable line speeds and the planned sequence of batches. Such a comparison would help establish whether announced capacity is usable for the assortment customers actually order, rather than only for an unspecified average product. Matching the technical capability to a specific order makes a capacity measure useful for a commercial decision.
Demand quality matters alongside demand quantity
For a manufacturer evaluating additional volume, the commercial problem is not simply finding enough orders. Orders differ in the amount retained after serving the customer, their predictability and the resources needed to fulfil them. A large order could occupy capacity while contributing less than a smaller, better matched one. The available announcement gives no customer-level data, so it cannot identify which type of demand Abi experienced.
A useful prospective review would examine whether planned output corresponds to repeatable orders, a temporary promotion or inventory placed into a distribution channel. These situations may all appear as shipments at a point in time, yet imply different future requirements. Distinguishing them would help a business judge whether the commercial pipeline can support its operating plan beyond an initial launch.
Customer concentration is another possible investigation, not a fact inferred from the annual figures. A manufacturer should understand how much of a proposed capacity increase depends on a small set of buyers and how those buyers’ requirements fit the production schedule. The purpose is to test the resilience of a sales plan. It is not to claim that this company has a concentration problem without disclosed evidence.
The export growth percentage leaves the base unknown
An export revenue growth rate supplies direction for that particular money measure, but not its absolute scale. Without the opening or closing export amount, a reader cannot determine how large the segment was within the company. Without export tonnage, the reader cannot determine whether more physical product was shipped. It would be incorrect to describe the reported percentage as a growth rate for export volume.
This matters when considering whether external markets could support more production. A positive percentage from an undisclosed base cannot establish how much additional capacity a channel could absorb. Nor does it establish margin, customer retention or the cost of serving those destinations. A meaningful assessment would need the segment’s scale and economics before connecting it to a plant’s production potential.
The company’s reported distribution reach in Russia and beyond supplies geographic context, rather than a market-by-market demand forecast. The analysis does not infer that every market bought the same products or grew at the same rate. A broad distribution footprint and a profitable route for incremental output are related questions, but the first does not resolve the second.
A short management checklist makes the missing evidence visible
The public figures are most useful when they organise the next questions rather than pretend to answer every question. The following checklist separates the commercial and operating tests. It can be applied to a manufacturer with changing revenue and physical sales without assuming access to its private records.
- Confirm that revenue and tonnage use a comparable period and business perimeter.
- Separate quantity effects from comparable-product selling values and assortment changes.
- Check the costs and commercial adjustments before making a margin claim.
- Define whether a new asset supports growth, substitution, flexibility or several purposes.
- Connect planned output to orders, delivery requirements and repeatable customer demand.
- Keep daily capacity, annual output, shipments and collected cash as separate measures.
- Establish the export segment’s absolute base before assigning it a role in expansion.
The checklist also provides a reporting discipline. Each conclusion should identify its supporting measure and the period it covers. If a figure is a target, it should remain labelled as a target; if it is a calculation, the formula and rounding should be visible. This makes a later comparison possible without rewriting an earlier expectation as an achieved result.
What the April account establishes
Abi’s announcement creates a clear starting point for analysis: money sales and physical sales moved in different directions while the company described new production capacity and a broader investment programme. That combination merits a closer examination of commercial composition and the route from potential output to demand. It does not establish a single causal explanation for the revenue change.
The strongest reading keeps that distinction intact. The revenue-per-tonne calculation identifies a question about price and mix; it does not answer it. The capacity announcement identifies an operating capability; it does not prove its annual utilisation. The export growth rate identifies movement in one segment; it does not reveal the segment’s scale. Together, these boundaries turn a short annual update into a practical agenda for a more complete business review.