An August 5, 2025 Manufacturing Dive article examines water use in semiconductor manufacturing, including reclamation, reuse and water consumption per unit of production. Those subjects raise distinct measurement questions. A share describing reused flow and a ratio describing water use relative to output do not have the same denominator.
The original analysis below uses a deliberately simplified, invented flow account to explain that distinction. It supplies no actual plant data, treatment specifications or assessment of water quality. All quantities are abstract volume and output units. The account measures external intake rather than claiming to reproduce a company’s definition of consumption. Its purpose is to show what different ratios can establish and why their definitions must accompany them.
Begin with the two questions the ratios answer
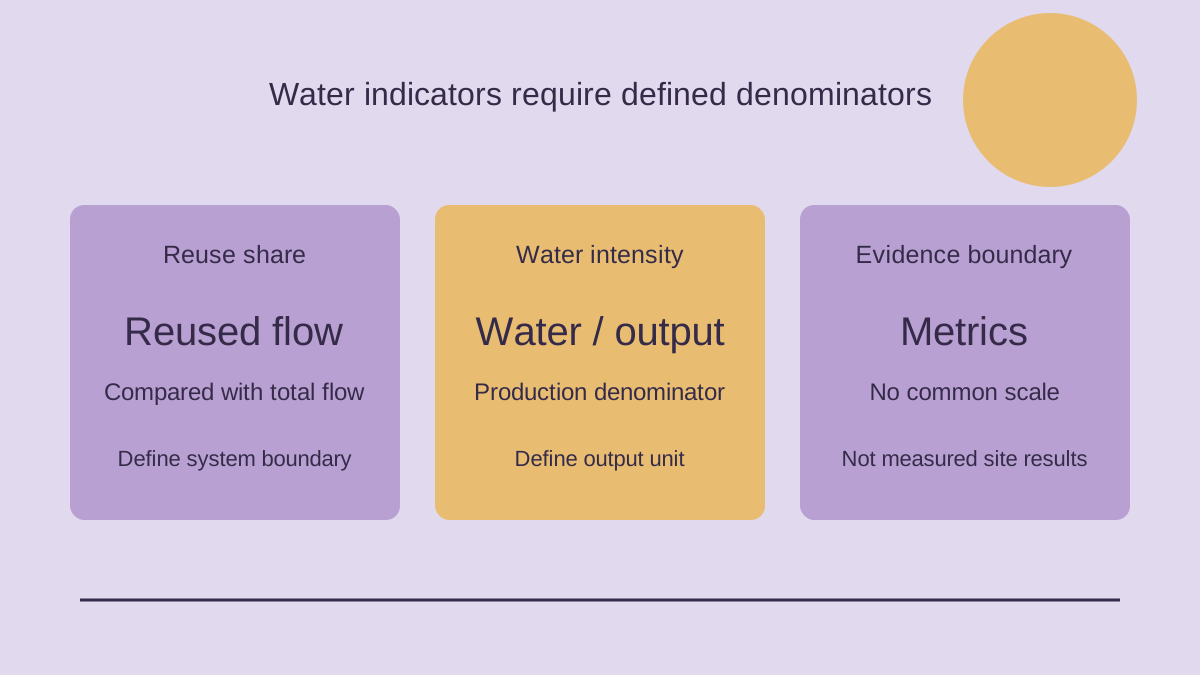
A reuse share asks how much of a defined service flow comes from a defined reused stream. An intake intensity asks how much external water enters the account for each defined unit of output. The first ratio divides one water quantity by another water quantity. The second divides a water quantity by an output quantity. A higher reuse share and a lower intake intensity might occur together, but their formulas do not require that result. Knowing one ratio does not supply the missing denominator of the other.
This is a reading problem before it is an engineering problem. A headline containing a percentage may appear to describe an overall reduction, even when the percentage concerns the composition of a flow. A headline containing a per-unit quantity may appear to describe the total volume, even when the quantity concerns volume relative to output. Both statements need their objects restored. The reader should be able to say what was divided by what without searching for an implied definition somewhere else in the article.
That discipline also protects comparisons between periods. If the first period reports the share of a service flow and the second reports the share of external supply, the apparent trend would join different measures. If output changes from one product basis to another, an intensity trend could similarly lose its meaning. The calculations might still be individually correct. The comparison fails when the labels conceal that their denominators describe different things. Keeping the formulas visible makes that change discoverable before a conclusion is drawn.
Draw a small account with one internal return
For the invented model, imagine an account with one external inlet, one service point, one internal return stream and one external outlet. External intake joins the internal return before reaching the service point. After passing that point, part of the flow returns internally and the rest leaves the account. Opening and closing stored volumes are equal. These are assumptions chosen to make the arithmetic transparent; they are not a process diagram for a semiconductor plant or a description of a real treatment system.
In this model, service flow equals external intake plus internal return. The service point’s outgoing flow equals the returning portion plus the externally leaving portion. Because stored volume does not change and there are no other inlets or outlets in the invented account, external intake equals external outflow over the observation period. The internal return cancels from that external balance. Counting it as a new external source would change the meaning of intake and double-count water crossing an internal measurement point.
The model deliberately keeps all externally leaving water in one outlet quantity. It does not distinguish evaporation, product incorporation or discharge, and it does not label the outlet as a particular real-world destination. Consequently, its intake ratio is not a claim about a reported consumption ratio. A more detailed real account would need its own categories and measurements. The simplified account remains useful because it separates circulation inside a boundary from water crossing that boundary, which is the distinction needed for the following calculations.
Calculate the first period without changing units
In invented period A, external intake is 100 abstract volume units and internal return is 100 units. Service flow is therefore 200 units. The reuse share at the service point is 100 divided by 200, or 50 percent. External outflow is 100 units under the model’s unchanged-storage assumption. No treatment loss or efficiency figure is inferred from this balance. The account simply states where its abstract volumes enter, circulate and leave during the chosen observation period.
Output in period A is 50 abstract output units. External intake intensity is therefore 100 divided by 50, or 2 volume units per output unit. The service-flow ratio would instead be 200 divided by 50, or 4 volume units per output unit. Those are two different ratios, each with a stated numerator. Calling both of them “water per unit” without qualification would erase the difference between external intake and gross flow through the invented service point.
The example’s two 100-unit figures must not be added and then presented as unique external water drawn into the account. Their sum is service flow, a quantity that includes the internal return. It can be useful when the question concerns flow at that service point. It answers a different question from the quantity crossing the inlet from outside. The same water can contribute to a circulation measurement more than once; that does not turn repeated internal measurement into repeated external intake.
Change the second period and observe both ratios
In invented period B, external intake rises to 120 volume units and internal return rises to 180 units. Service flow is now 300 units, and the reuse share is 180 divided by 300, or 60 percent. External outflow is 120 units under the same assumptions. Compared with period A, the reuse share has risen from 50 to 60 percent. This is a change of 10 percentage points, distinct from a 20 percent relative increase in the share.
Output in period B falls to 40 output units. External intake intensity is 120 divided by 40, or 3 volume units per output unit. Thus the model shows a higher reuse share alongside a higher intake intensity. External intake itself has also risen, from 100 to 120 units. None of these observations contradicts the others: each uses a stated numerator and denominator. The example was constructed to demonstrate the coexistence of these changes, not to explain a real manufacturer’s performance.
The gross service-flow ratio has changed as well, from 4 to 7.5 volume units per output unit, because 300 divided by 40 equals 7.5. That ratio should remain separately labelled. It includes circulation and is not interchangeable with external intake intensity. Displaying all three ratios together exposes their different meanings: a composition share at one service point, an external intake ratio relative to output and a gross service-flow ratio relative to output. A single celebratory or critical adjective would not replace that explanation.
Keep the counterfactual distinct from the observed account
It may be tempting to say that the additional internal return saved an equal quantity of external water. The invented balance alone does not establish that saving. A saving claim compares an observed account with an alternative account: what would intake have been without the change, under specified conditions? The example provides two periods with different service flow and output, not a controlled alternative with otherwise equal conditions. Subtracting their intake totals gives a difference between periods, rather than an established avoided intake.
An explicit additional scenario could hold service flow at 300 units and set internal return at 150 units. Under the same simple formula, external intake would then be 150 units. Compared with period B’s 120 units, the difference would be 30 units. This is an invented scenario comparison, defined by the chosen constant service flow and alternative return quantity. It does not show that any real plant could operate at those values or that the difference represents an achievable engineering improvement.
The distinction is useful in editorial language. “External intake differed by 30 units between these two invented scenarios” states the calculation. “The system saved 30 units” implies an established baseline and a real intervention. An author who wants to use the second formulation would need evidence supporting those additional elements. Keeping the first formulation here preserves the example’s purpose: it helps the reader identify the assumptions that a comparison needs, without disguising those assumptions as measured outcomes.
Put the period and stored volume beside the flows
The unchanged-storage assumption carries part of the model’s balance. If the account starts with a different stored volume from the one it ends with, external intake need not equal external outflow over that interval. For a separate invented illustration, 100 entering units and 90 leaving units would be compatible with a 10-unit increase in stored volume, assuming no other external movements. The difference should not automatically be named a loss or a reuse benefit. Its meaning depends on the stock observation.
A period boundary can also divide movements that a casual description treats as one cycle. Intake might occur before the beginning of a reporting window, while later internal service flow falls inside it. A ratio using quantities from different windows would then answer an unclear question. Every volume in a comparison needs a specified interval. If a publication uses several reporting periods, the reader should be able to identify which belongs to each value before combining the values in a calculation.
This does not require making the public account unnecessarily complicated. A short note can state the reporting interval, the measurement boundary and whether stored volume changed. When a value is unavailable, the account can say so rather than adopting an unexplained zero. Those disclosures determine which calculations are possible. They also prevent a visually neat table from suggesting a complete water balance when it contains only selected flow measures. Completeness is a property of the defined account, not of the number of rows displayed.
Do not let a ratio become a quality statement
The invented reused stream has a volume but no supplied quality measurements. Its 60 percent share therefore says nothing about its suitability for a particular production step. A quantity account and a quality account can be related, but one does not contain the other automatically. This article gives no purity thresholds, treatment recipes or operating instructions. Its simple return line exists to demonstrate accounting relationships, rather than to certify that a returned stream can be used in any real manufacturing operation.
Similarly, an aggregate flow figure would not reveal the distribution of qualities within that flow. A real report could describe several separately measured streams, each with its own destination and characteristics. Summing their volumes might answer a quantity question, while still leaving their uses distinct. The reader would need the accompanying descriptions to interpret that sum. The appropriate response to missing quality information is to keep the quantity claim narrow, rather than infer a uniform quality from a common volume unit.
These distinctions matter when comparing proposals with results. A proposed return route, a measured returned quantity and a demonstrated suitability for a specific use describe different stages. An announcement about one stage should not silently become confirmation of the others. A careful follow-up can add the new stage and identify its evidence. That gives the reader a developing account of the project while preserving the narrower historical statement that the earlier material actually supported.
A compact reporting record preserves the calculation
A useful explanatory record would store each quantity together with its definition. The following fields are an original reporting proposal for the invented example, rather than a standard or a company practice. They allow a reader to reproduce the ratios and identify what is missing. Their value lies in the relationship between the fields: a quantity, boundary, period and denominator together make a calculation interpretable, whereas a quantity alone may leave several different calculations possible.
- Measurement boundary: name the account and the service point. This distinguishes water crossing the external inlet from flow measured at the internal service point, and keeps an internal transfer from appearing as a new external source.
- Flow definition: label external intake, internal return, service flow and external outflow separately. Preserve the distinction between intake and any separately defined consumption measure instead of substituting one name for another.
- Observation period: attach the same start and end to quantities used in one ratio. If a value belongs to another interval, display that interval and explain why the value is not included in the calculation.
- Stored volume: record opening and closing values or explicitly state the unchanged-storage assumption. An unexplained difference between intake and outflow should remain unresolved until the necessary movements and stock values are identified.
- Output denominator: define the output unit and keep it consistent between periods. A change in what counts as output requires a new explanation before an apparent intensity trend can be interpreted as a like-for-like comparison.
- Calculation status: distinguish a measured account, an invented teaching example and an alternative scenario. A transparent scenario can explain a formula without becoming evidence that a real intervention produced the illustrated difference.
The semiconductor-water report supplies the context for examining these measurement questions. The invented account then shows why a rising reuse share does not, on its own, establish falling external intake or lower intake per output unit. A useful comparison keeps each numerator, denominator, period and boundary visible. That allows a later report to add real observations without asking a percentage about circulation to answer a separate question about production intensity.